Hello World

吞风吻雨葬落日 欺山赶海踏雪径

0%

线上metaspace利用率报警

线上metaspace利用率报警处理记录。

问题处理

收到报警之后去机器查看

1
2
$ps -ef | grep java
admin 188578 0 12 10:58 ? 00:27:07 /opt/xxx/java/bin/java -server -Xms4g -Xmx4g -Xmn2g -XX:PermSize=512m -XX:MaxPermSize=512m -XX:MaxDirectMemorySize=1g -XX:SurvivorRatio=10 -XX:+UseConcMarkSweepGC -XX:+UseCMSCompactAtFullCollection -XX:CMSMaxAbortablePrecleanTime=5000 -XX:+CMSClassUnloadingEnabled -XX:CMSInitiatingOccupancyFraction=80 -XX:+UseCMSInitiatingOccupancyOnly -XX:+ExplicitGCInvokesConcurrent -Dsun.rmi.dgc.server.gcInterval=2592000000 -Dsun.rmi.dgc.client.gcInterval=2592000000 -XX:ParallelGCThreads=4 -Xloggc:/home/admin/logs/gc.log -XX:+PrintGCDetails -XX:+PrintGCDateStamps -XX:+HeapDumpOnOutOfMemoryError -XX:HeapDumpPath=/home/admin/logs/java.hprof -XX:+UseAsyncGCLog -Djava.awt.headless=true -Dsun.net.client.defaultConnectTimeout=10000 -Dsun.net.client.defaultReadTimeout=30000 -DJM.LOG.PATH=/home/admin/logs -DJM.SNAPSHOT.PATH=/home/admin/snapshots -Dfile.encoding=UTF-8 -Dhsf.publish.delayed=true -Dproject.name=app -Dpandora.boot.wait=true -Dlog4j.defaultInitOverride=true -Dserver.port=7001 -Dmanagement.port=7002 -Dmanagement.server.port=7002 -Dpandora.location=/home/admin/app/target/xxx-hsf.sar -classpath /home/admin/app/target/app -Dapp.location=/home/admin/app/target/app -Djava.endorsed.dirs= -Djava.io.tmpdir=/home/admin/app/.default/temp com.xxx.pandora.boot.loader.SarLauncher

$/opt/xxx/java/bin/jstat -gcutil 188578
OpenJDK 64-Bit Server VM warning: bad AJDK_MAX_PROCESSORS_LIMIT value 4
S0 S1 E O M CCS YGC YGCT FGC FGCT GCT
0.00 5.10 15.48 6.56 97.87 96.00 49 2.424 5 1.415 3.839
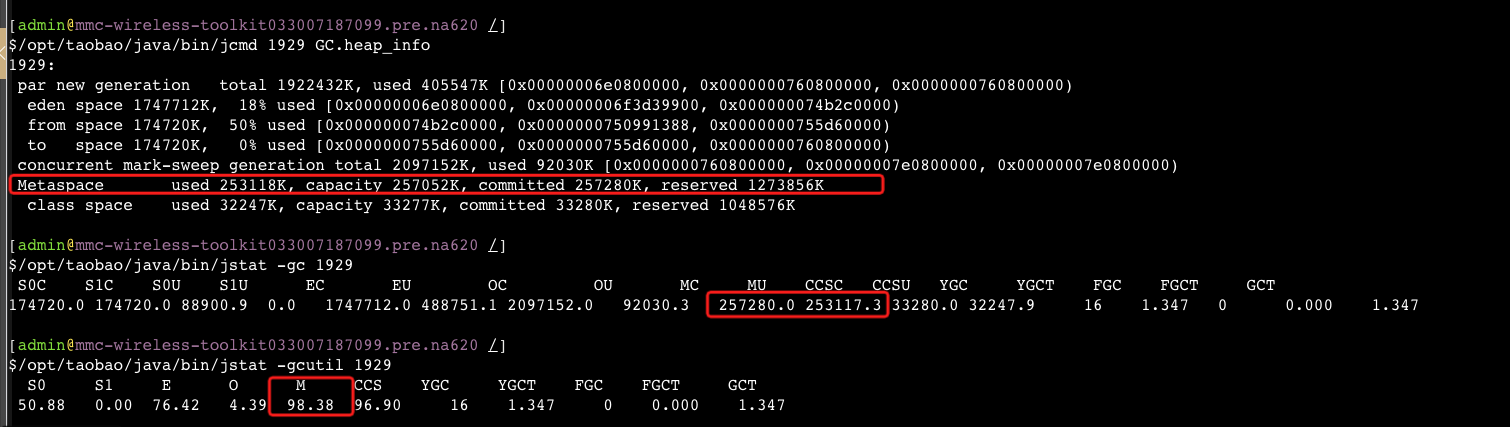
利用率的确比较高了,查看下大小:

$/opt/xxx/java/bin/jstat -gc 188578
OpenJDK 64-Bit Server VM warning: bad AJDK_MAX_PROCESSORS_LIMIT value 4
S0C S1C S0U S1U EC EU OC OU MC MU CCSC CCSU YGC YGCT FGC FGCT GCT
174720.0 174720.0 7397.6 0.0 1747712.0 354401.7 2097152.0 137568.0 263396.0 257330.6 33852.0 32424.2 46 2.372 5 1.415 3.787

总大小 263396.0 kb,257M太小了。需要重新设置。

修改启动脚本(原先的启动脚本切换为java8之后一直没有修改,随着业务的发展使用率就超了):

1
2
3
-XX:PermSize=512m -XX:MaxPermSize=512m
修改为
-XX:MetaspaceSize=512m -XX:MaxMetaspaceSize=512m

产生疑问

整个处理过程中出现了疑问:线上四台机器启动脚本都是一个,为什么只有一台机器预警?

查询其他机器,发现按上面的查询方式,的确使用率都达到了90%以上:

但是查看监控页面发现只有50%,到底哪里有问题。
百度问题的时候,发现使用Arthas也是可以查看的,换成Arthas看看发现了预警与不预警的机器的不一致:
预警机器
预警机器

非预警机器
非预警机器

针对metaspace出现了三列数据,used/total/max 预警机器的max没有设置是-1,而非预警机器的max则设置成了512m.
使用jstat -gcutil 查看一直是查看的 used/total的值,而预警是used/max得出的占比。为什么会有三个值,各自有代表什么意思?

jstat文档
google发现 https://bugs.openjdk.org/browse/JDK-8077987 中有提到

The documentation that MC in the jstat output refers to Metaspace capacity is being changed so that MC refers to Metaspace committed.

这里提到了Metaspace committed
参考下面文章
https://stackoverflow.com/questions/41468670/difference-in-used-committed-and-max-heap-memory
https://docs.oracle.com/javase/8/docs/api/java/lang/management/MemoryUsage.html

1
2
3
4
5
6
7
8
9
10
11
12
13
14
15
16
17
18
19

init represents the initial amount of memory (in bytes) that the Java virtual machine requests from the operating system for memory management during startup. The Java virtual machine may request additional memory from the operating system and may also release memory to the system over time. The value of init may be undefined.
used represents the amount of memory currently used (in bytes).
committed represents the amount of memory (in bytes) that is guaranteed to be available for use by the Java virtual machine. The amount of committed memory may change over time (increase or decrease). The Java virtual machine may release memory to the system and committed could be less than init. committed will always be greater than or equal to used.
max represents the maximum amount of memory (in bytes) that can be used for memory management. Its value may be undefined. The maximum amount of memory may change over time if defined. The amount of used and committed memory will always be less than or equal to max if max is defined. A memory allocation may fail if it attempts to increase the used memory such that used > committed even if used <= max would still be true (for example, when the system is low on virtual memory).
Below is a picture showing an example of a memory pool:
+----------------------------------------------+
+//////////////// | +
+//////////////// | +
+----------------------------------------------+

|--------|
init
|---------------|
used
|---------------------------|
committed
|----------------------------------------------|
max

https://stuefe.de/posts/metaspace/sizing-metaspace/
这里讲的很清楚 , committed是能保证的内存大小,而Max是允许使用的最大大小,但是不一定能保证申请到这么大。所以我感觉使用 used/max 来计算使用率其实并不准确。

参考

https://zhuanlan.zhihu.com/p/476375396